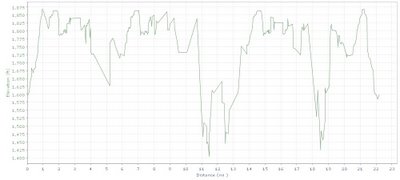
First up is the GPS data from last year's race. While the overall data isn't the greatest (probably due to the tree coverage), it does show that it's about 1500' of climbing and 10 miles per lap
 The complete GPS data is available over at Motionbased.
Other data points are race reports. I think the best ones are Team WrongWay's 2005 coverage. Multiple people talk about their race in great detail.
Finally, for those visual learners, check out the photos from last year.
No comments:
Post a Comment